Home
Stock Market Weather Forecast & Risk Indicators
Driptometer reads ten market signals and turns them into a plain-English score — Clear Skies, Partly Cloudy, or Storm Clouds. No advice. No accounts.
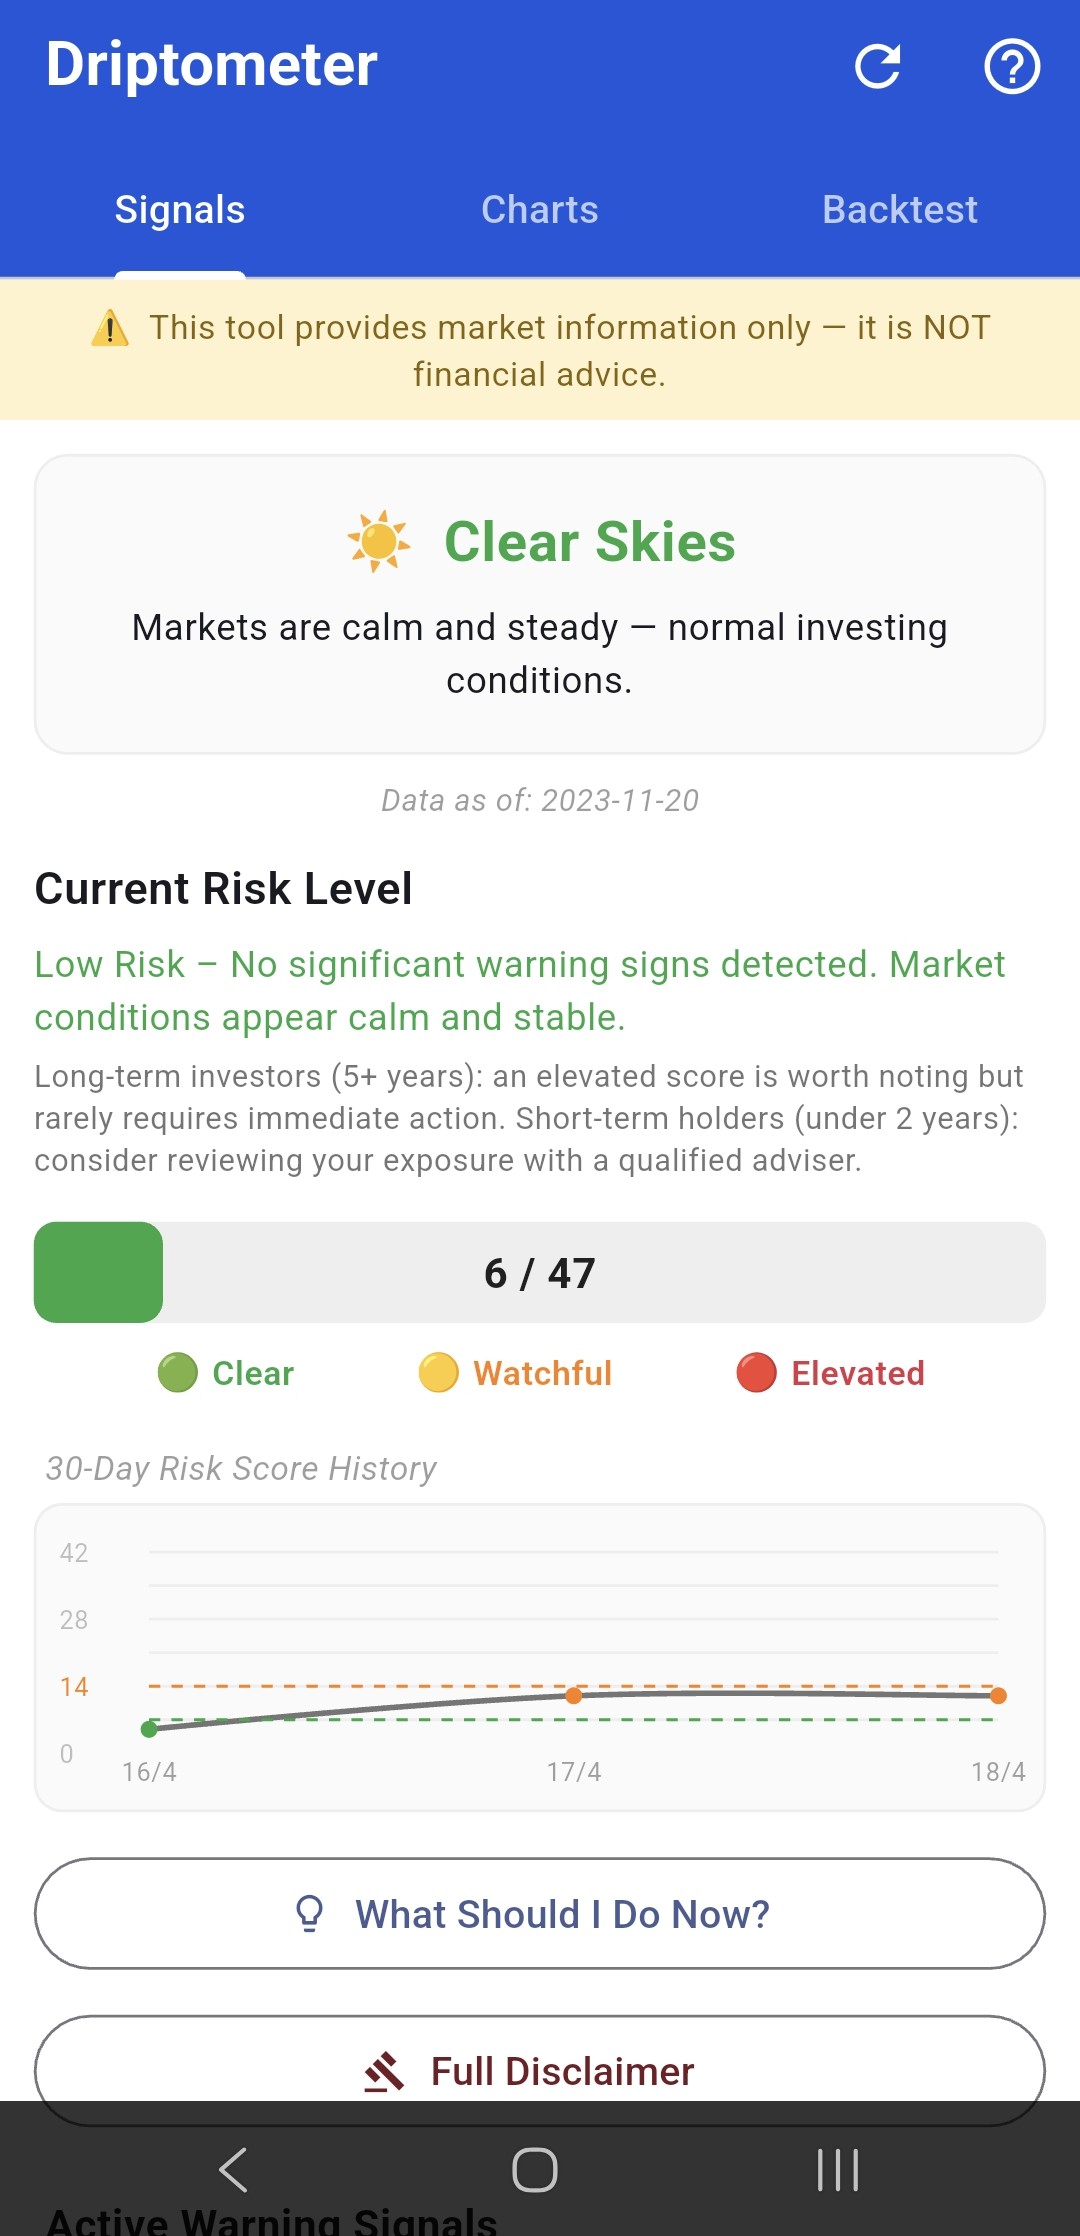
Ten indicators.
One honest read.
Professional investors track dozens of signals. We chose ten that matter most for the retail crowd — moving averages, volatility, credit spreads, the yield curve — and combined them into a single score from 0 to 47.
Clear Skies
No significant warning signs are firing. Markets functioning normally and major trends intact.
Partly Cloudy
Some warning signs firing. Nothing screaming yet, but worth knowing about.
Storm Clouds
Multiple indicators flashing. Historically clustered around stressful market periods.
Free Android App for Tracking Market Momentum and Market Conditions
Driptometer is a free Android app. No sign-up, no email, no payment details, no ads. Open it whenever you want a five-second read on market conditions.
Scan to install
Point your camera at this code — opens straight to the Play Store.